This website presents, in a format convenient for fish welfare advocates, key industry and economic data relating to fish farming in Europe. Data is automatically updated monthly.
Production
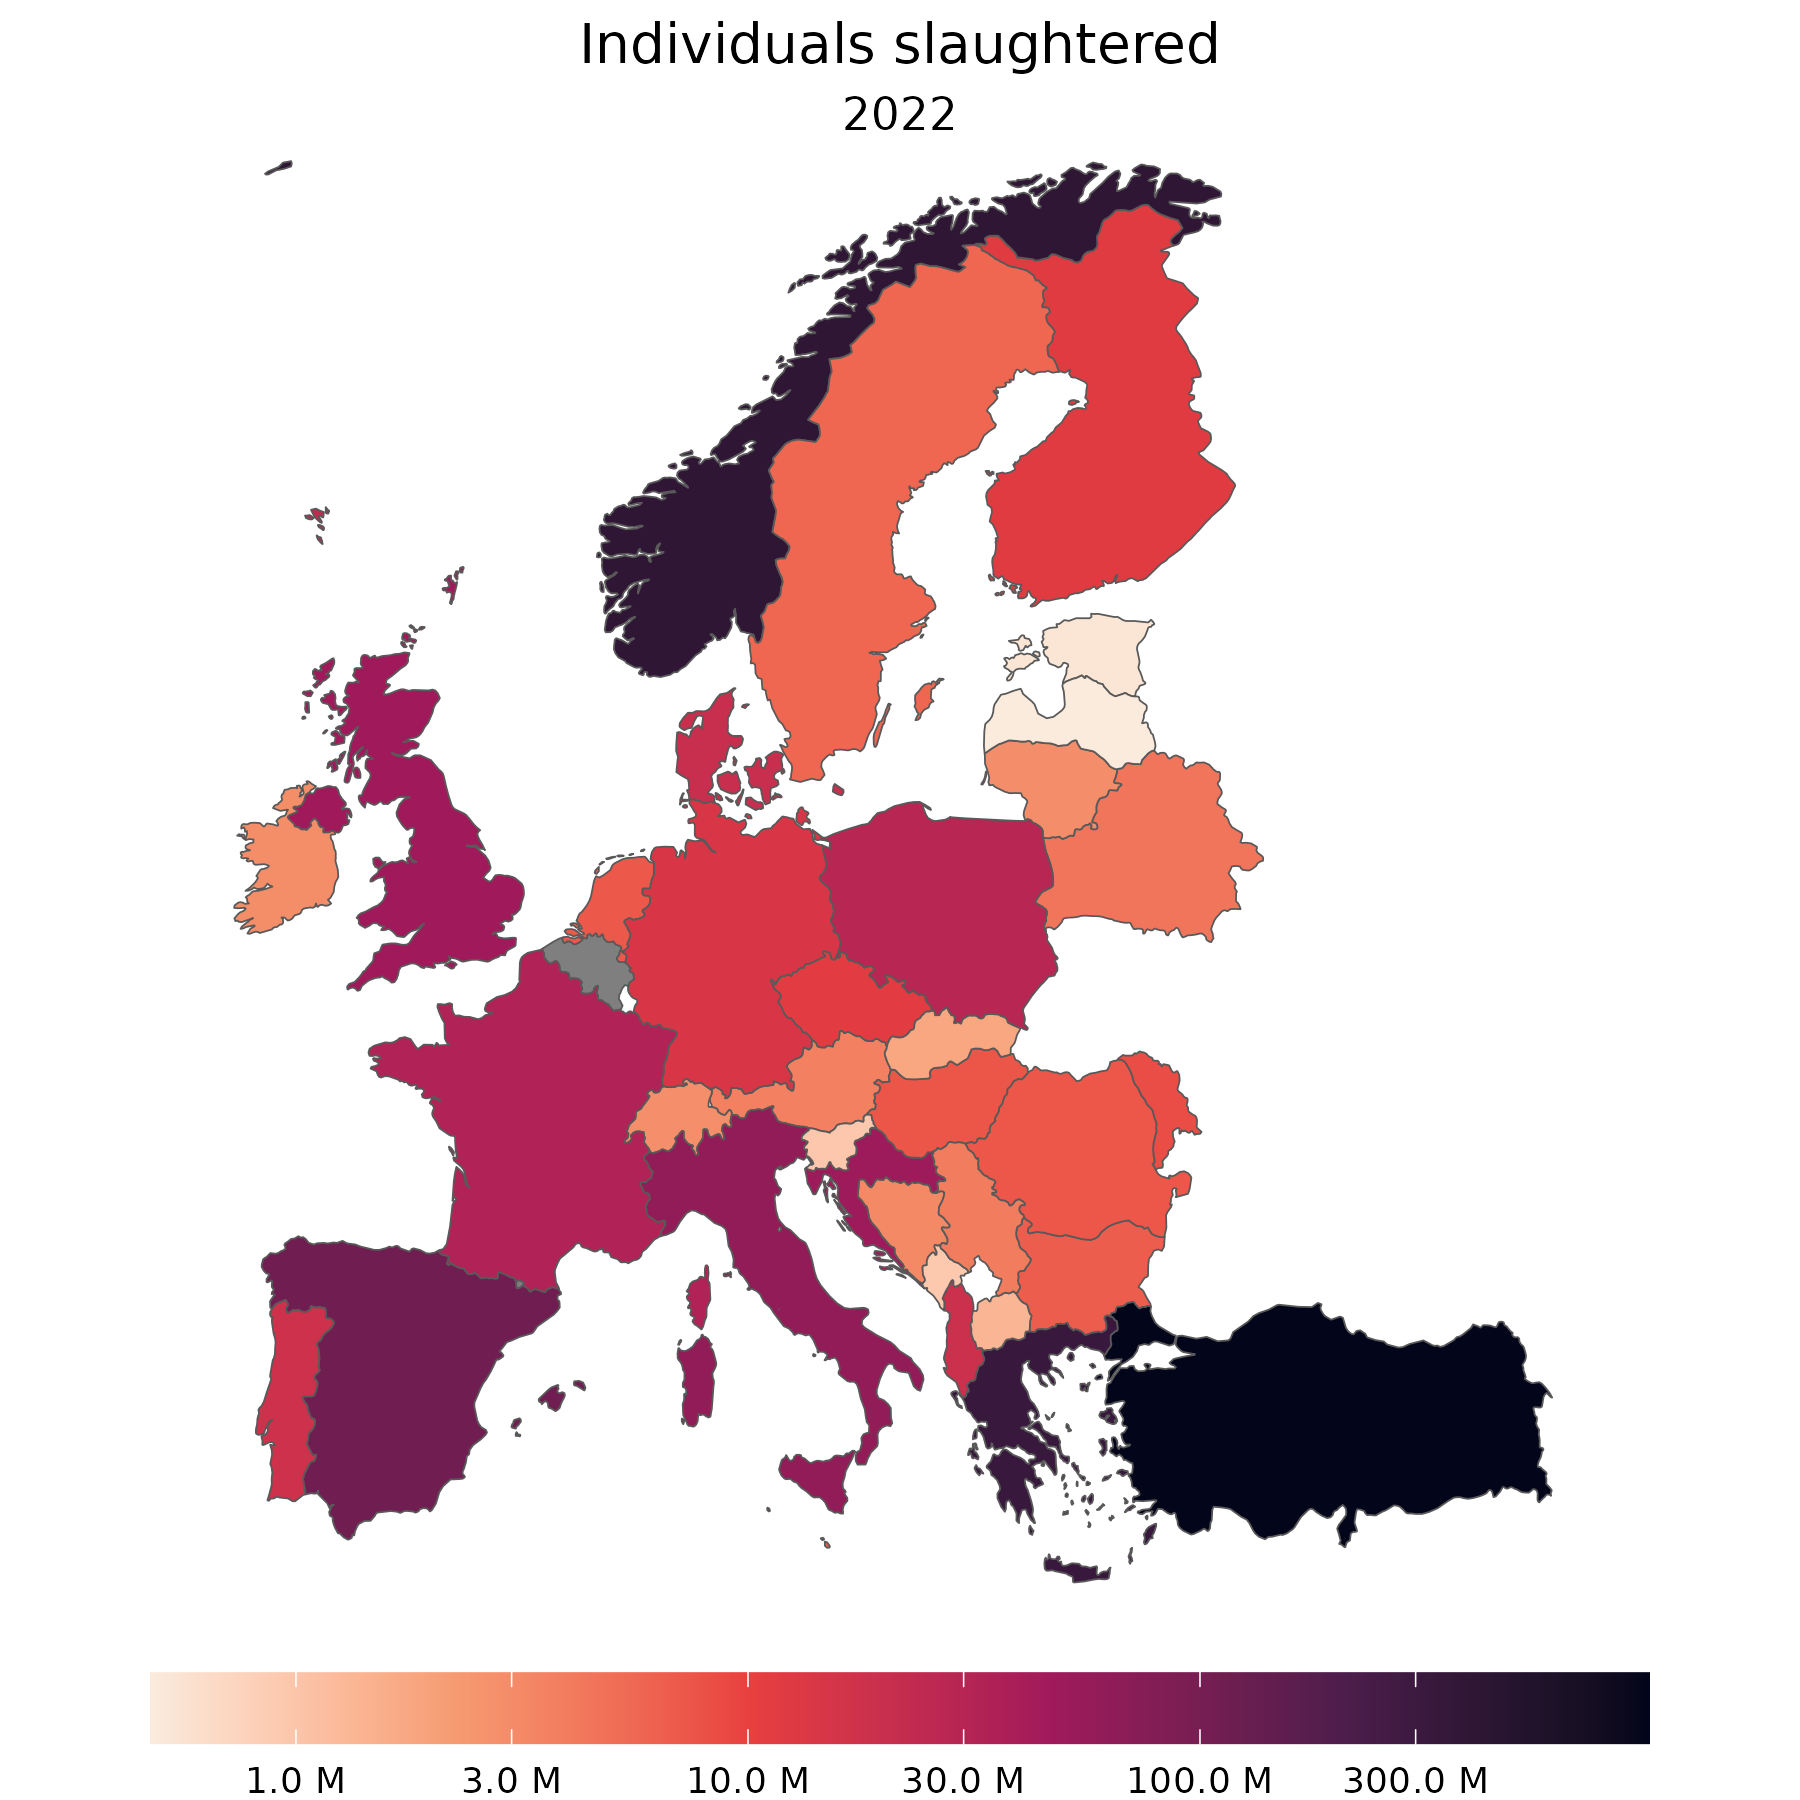
| Country | Bass and bream (M) | Salmonids (M) | Carp (M) | Other (M) | Total (M) |
|---|---|---|---|---|---|
| Turkey | 827.1 | 147 | 0.2 | 3 | 977.3 |
| Norway | 0 | 403 | 0 | 0 | 403 |
| Greece | 318.8 | 1.5 | 0 | 4.2 | 324.5 |
| Spain | 86.1 | 12.7 | 0 | 12.3 | 111.1 |
| Italy | 35.8 | 23.3 | 0.1 | 1.6 | 60.8 |
| Croatia | 46.4 | 0.4 | 2.2 | 0.4 | 49.4 |
| United Kingdom | 0 | 47.4 | 0.2 | 0 | 47.6 |
| France | 3.8 | 25.9 | 0.7 | 2.8 | 33.2 |
| Poland | 0 | 15.4 | 13 | 0.3 | 28.7 |
| Faroe Islands | 0 | 23.6 | 0 | 0 | 23.6 |
| Cyprus | 20.6 | 0 | 0 | 0.9 | 21.5 |
| Denmark | 0 | 19.1 | 0 | 1.2 | 20.3 |
| Albania | 17.8 | 1 | 0 | 0 | 18.8 |
| Portugal | 14.4 | 0.7 | 0 | 2.9 | 18 |
| Germany | 0 | 6.6 | 2.8 | 5.1 | 14.5 |
| Finland | 0 | 11.7 | 0 | 0 | 11.7 |
| Czechia | 0 | 0.3 | 11.1 | 0.2 | 11.6 |
| Iceland | 0 | 10.6 | 0 | 0 | 10.6 |
| Moldova | 0 | 0 | 8.4 | 0 | 8.4 |
| Hungary | 0 | 0 | 7.4 | 0 | 7.4 |
| Romania | 0 | 2.4 | 4.9 | 0.1 | 7.4 |
| Netherlands | 0 | 0 | 0 | 7 | 7 |
| Bulgaria | 0 | 2.8 | 2.3 | 1.5 | 6.6 |
| Malta | 6.3 | 0 | 0 | 0 | 6.3 |
| Sweden | 0 | 5.8 | 0 | 0 | 5.8 |
| Belarus | 0 | 0.2 | 4.3 | 0 | 4.5 |
| Serbia | 0 | 1.3 | 2.6 | 0 | 3.9 |
| Austria | 0 | 1.7 | 0.4 | 1.6 | 3.7 |
| Bosnia and Herz. | 0.3 | 2.6 | 0.2 | 0 | 3.1 |
| Switzerland | 0 | 1.1 | 0 | 1.8 | 2.9 |
| Ireland | 0 | 2.9 | 0 | 0 | 2.9 |
| Lithuania | 0 | 0.2 | 2.1 | 0.6 | 2.9 |
| Slovakia | 0 | 0.8 | 0.4 | 0.6 | 1.8 |
| North Macedonia | 0 | 1.2 | 0.1 | 0 | 1.3 |
| Montenegro | 0.4 | 0.6 | 0 | 0 | 1 |
| Slovenia | 0.2 | 0.6 | 0.1 | 0.1 | 1 |
| Estonia | 0 | 0.5 | 0 | 0 | 0.5 |
| Latvia | 0 | 0 | 0.4 | 0 | 0.4 |
Cleaner fish
Cleaner fish, which are fish used to control lice on salmon farms, are not included in statistics of production. However, there are a few published estimates for key countries.
- Norway: 34 million cleaner fish used in 2023 (Sommerset et al., 2024). About half of these originate from cleaner fish farms and about half originate from wild-catch fisheries (Treasurer, 2018). The species are lumpfish (56%), goldsinny wrasse (18%), corkwing wrasse (17%), Ballan wrasse (5%), and other wrasse (4%) (Barrett et al., 2020).
- UK: 4.8 million cleaner fish used in 2018 (Treasurer, 2018). About two-thirds of these are from cleaner fish farms and about one-third from wild-catch fisheries. The species are lumpfish (4.3 million) and Ballan wrasse (500,000).
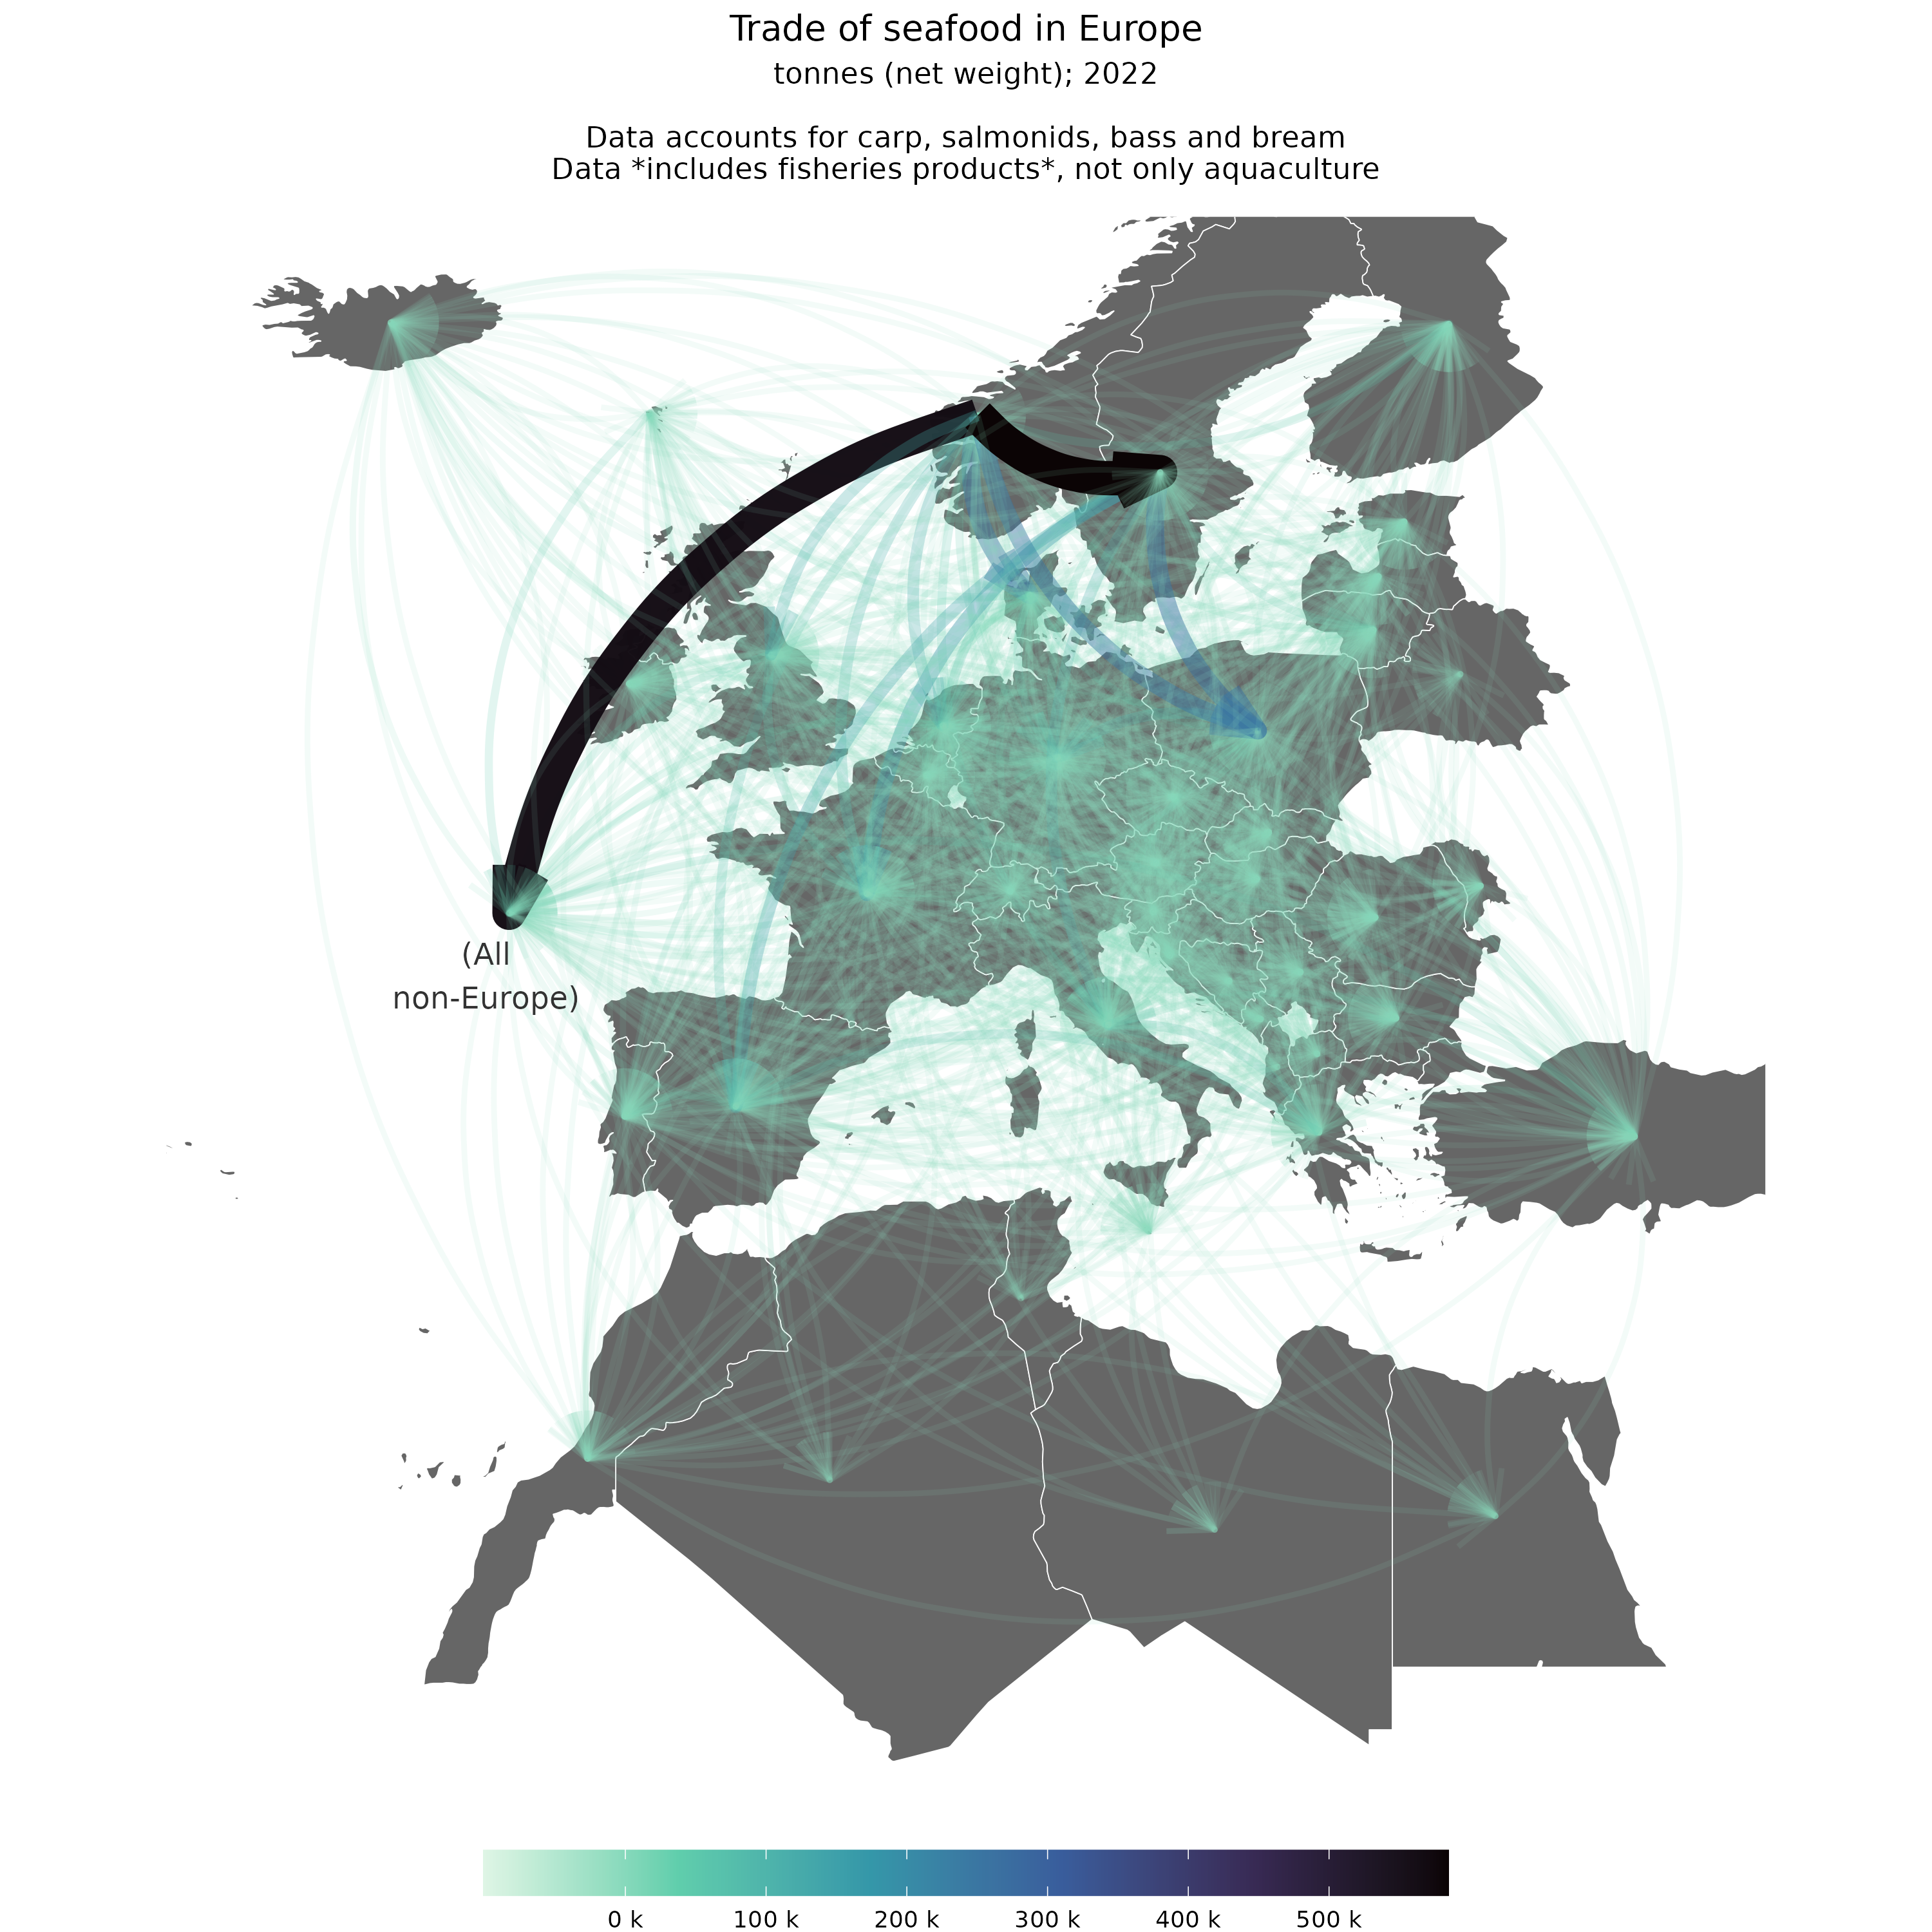
Trade
Retail prices
| Product | Country | Category | Product size | Date | Price (EUR/kg) |
|---|---|---|---|---|---|
| Gilthead seabream | Belgium | Fresh | 450 - 650 g | 2025-07-31 | 18.99 |
| Gilthead seabream | France | Fresh | 450 - 650 g | 2025-07-31 | 12.77 |
| Gilthead seabream | Greece | Fresh | 1 kg | 2025-07-31 | 12.5 |
| Gilthead seabream | Italy | Fresh | 300 - 650 G | 2025-07-31 | 17.19 |
| Gilthead seabream | Portugal | Fresh | 450 - 650 g | 2025-07-31 | 11.3 |
| Gilthead seabream | Romania | Fresh | 1 kg | 2025-07-31 | 60.84 |
| Gilthead seabream | Spain | Fresh | 450 - 650 g | 2025-07-31 | 8.75 |
| Salmon fillets | Belgium | Fresh | 100 - 300 g | 2025-07-31 | 31.01 |
| Salmon fillets | Denmark | Fresh | 1 kg | 2025-07-31 | 262.9 |
| Salmon fillets | Finland | Fresh | 1 kg | 2025-07-31 | 28.46 |
| Salmon fillets | France | Fresh | 300 - 600 g | 2025-07-31 | 25.11 |
| Salmon fillets | Germany | Fresh | 1 kg | 2025-07-31 | 20.07 |
| Salmon fillets | Greece | Fresh | 1 kg | 2025-07-31 | 23.9 |
| Salmon fillets | Ireland | Fresh | 1 kg | 2025-07-31 | 22.71 |
| Salmon fillets | Italy | Fresh | 200 - 300 g | 2025-07-31 | 30.04 |
| Salmon fillets | Netherlands | Fresh | 300 - 600 g | 2025-07-31 | 27.23 |
| Salmon fillets | Poland | Fresh | 1 kg | 2025-07-31 | 111.82 |
| Salmon fillets | Portugal | Fresh | 200 - 500 g | 2025-07-31 | 20.94 |
| Salmon fillets | Romania | Fresh | 1 kg | 2025-07-31 | 75.81 |
| Salmon fillets | Spain | Fresh | 300 - 600 g | 2025-07-31 | 24.7 |
| Salmon fillets | Sweden | Fresh | 1 kg | 2025-07-31 | 302.33 |
| Seabass | Belgium | Fresh | 300 - 400 g | 2025-07-31 | 19.13 |
| Seabass | France | Fresh | 450 - 600 g | 2025-07-31 | 11.74 |
| Seabass | Greece | Fresh | 1 kg | 2025-07-31 | 12.9 |
| Seabass | Italy | Fresh | 300 - 400 g | 2025-07-31 | 18.84 |
| Seabass | Portugal | Fresh | 300 - 500 g | 2025-07-31 | 11.63 |
| Seabass | Romania | Fresh | 1 kg | 2025-07-31 | 55.23 |
| Seabass | Spain | Fresh | 400 - 750 g | 2025-07-31 | 9.28 |
| Trout | Finland | Fresh | 1 kg | 2025-07-31 | 21.41 |
| Trout | Poland | Fresh | 1 kg | 2025-07-31 | 40.34 |
| Trout | Romania | Fresh | 1 kg | 2025-07-31 | 47.37 |
We have found four additional sources of price information that may be of interest.
- Annual Norway ex-farm (producer) price data can be downloaded from the Norwegian Directorate of Fisheries
- Quartlerly UK (Scottish) price data can be download from Salmon Scotland (see “Economic Quarterly” reports)
- UK retail prices from the Seafish report “Farmed seafood in multiple retail” reports average prices for March 2024 in GBP/kg: salmon = 20.53; warm water prawns = 17.18; sea bass = 16.25; sea bream = 15.23; shrimps = 16.19; tilapia 10.75.
- Türkiye producer prices from Turkish Statistical Institute database Fishery Statistics (Price of aquaculture products). However, due to the ongoing Turkish currency crisis, producer prices are experiencing drastic changes that are challenging to interpret in a meaningful way (e.g. distinguishing between currency value changes and the change in value of specific fish species).