Production (2024)
| Species | Harvest weight (g) | Harvest age (years) | Mortality rate | Production (t) | Individuals slaughtered | Individuals hatched | Individuals inventory |
|---|---|---|---|---|---|---|---|
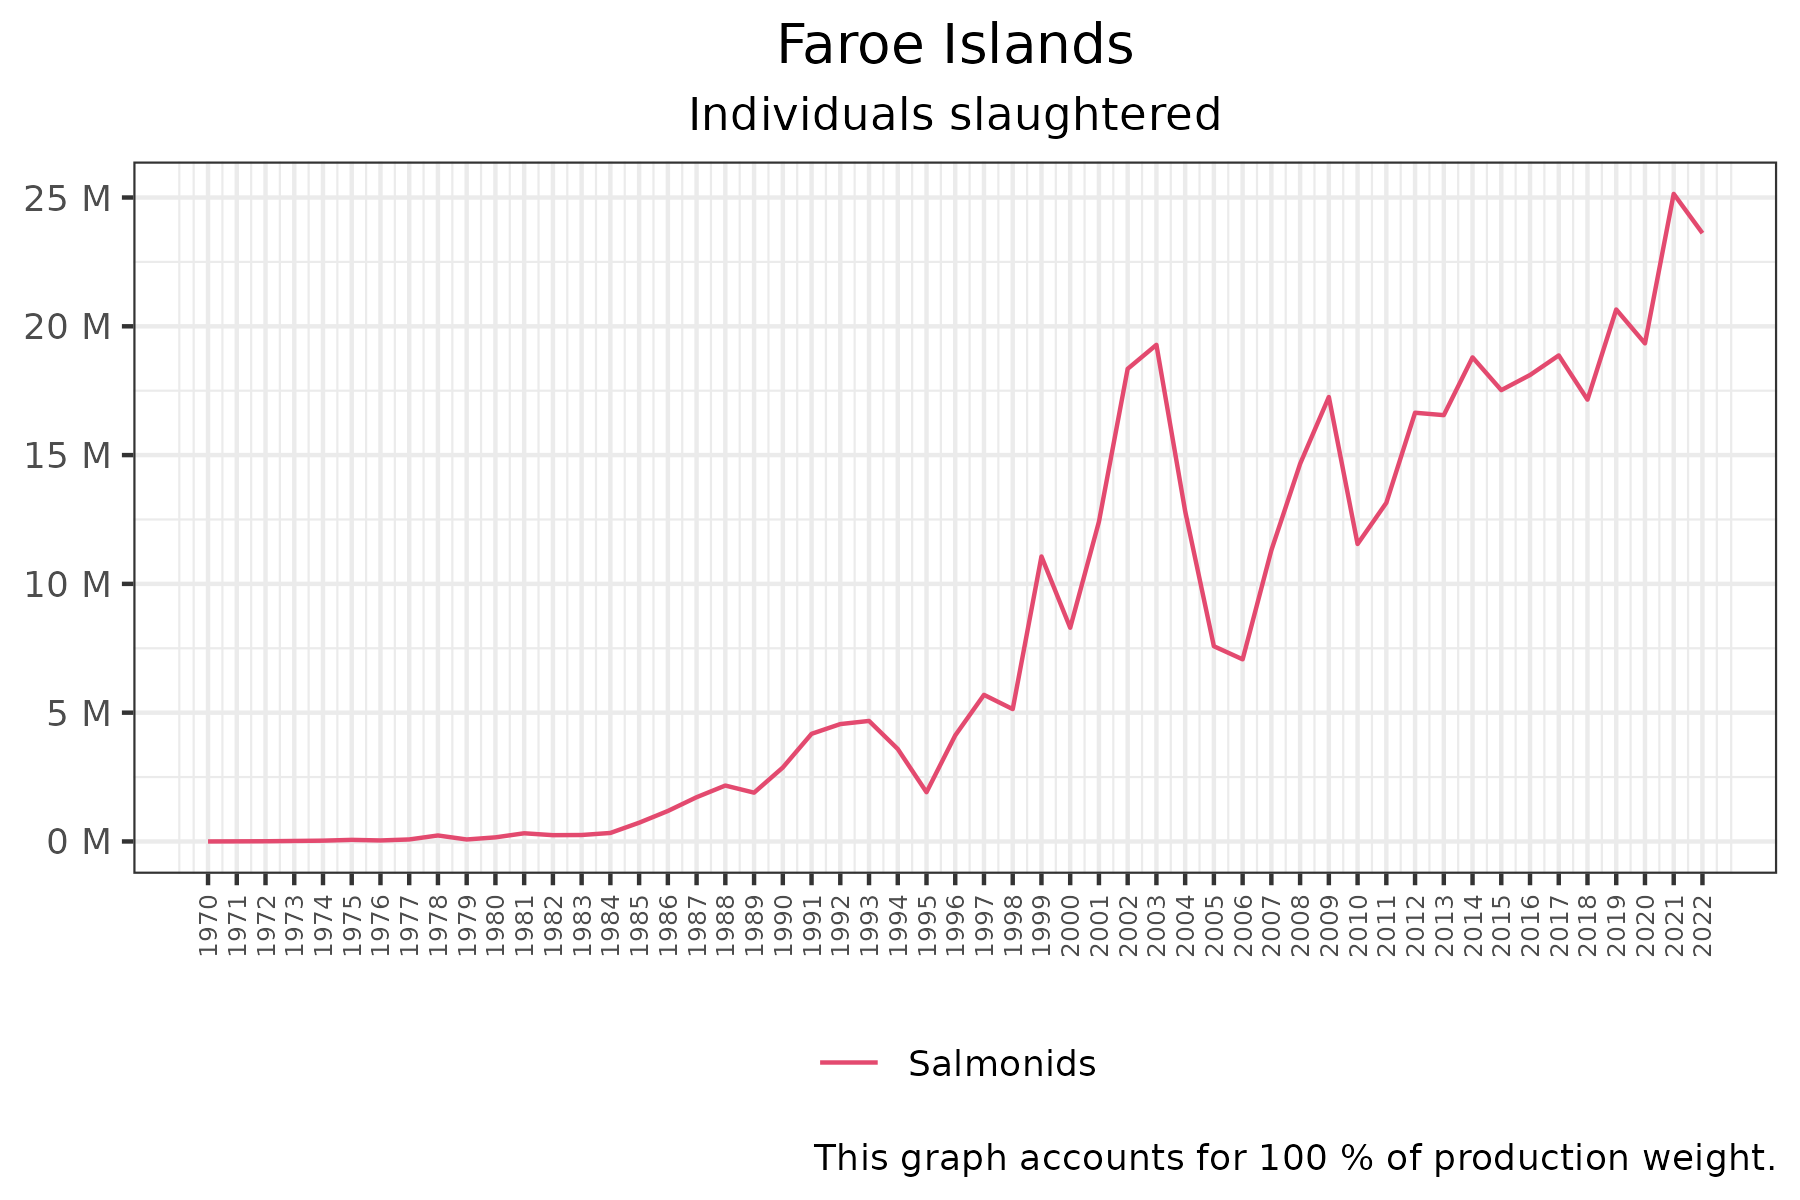
| Atlantic salmon | 4600 | 2.083 | 0.376 | 109162 | 23,730,870 | 63,114,015 | 49,439,312 |
Table notes: harvest weight, harvest age, and mortality rate are set by us as biological parameters (see bottom of page for details). Production is then used, with these parameters, to calculate individuals slaughtered, individuals hatched, and individuals inventory. 'Inventory' refers to the number of fish alive on animals at any one time. Production weight is rounded to the nearest tonne.
Biological parameters explained and cited here. Note that some biological parameters for less frequently farmed species are placeholder values.
Trade (2025)
Note: The following trade data is given as it is reported. Trade data can be inaccurate when a country imports fish for further processing and re-export. This is especially true for countries that act as a first port of entry to the EU, such as Sweden (the “Rotterdam effect”).
Exports
| Partner Country | Species | Quantity (t) |
|---|---|---|
| Other | Salmonids | 38,280 |
| Netherlands | Salmonids | 16,395 |
| France | Salmonids | 11,621 |
| Denmark | Salmonids | 11,382 |
| Spain | Salmonids | 10,684 |
| Italy | Salmonids | 5,015 |
| United Kingdom | Salmonids | 2,786 |
| Germany | Salmonids | 2,012 |
| Romania | Salmonids | 1,682 |
| Poland | Salmonids | 1,579 |
| Sweden | Salmonids | 1,249 |
| Portugal | Salmonids | 927 |
| Ireland | Salmonids | 731 |
| Lithuania | Salmonids | 518 |
| Czechia | Salmonids | 464 |
| Switzerland | Salmonids | 235 |
| Austria | Salmonids | 94 |
| Iceland | Salmonids | 79 |
| Bulgaria | Salmonids | 77 |
| Belgium | Salmonids | 55 |
| Estonia | Salmonids | 33 |
| Cyprus | Salmonids | 28 |
| Norway | Salmonids | 19 |
| Greece | Salmonids | 2 |
| Albania | Salmonids | 1 |
Imports
| Partner Country | Species | Quantity (t) |
|---|---|---|
| Norway | Salmonids | 1 |
| Latvia | Salmonids | 1 |
| Poland | Salmonids | 0 |
| Lithuania | Salmonids | 0 |
| Denmark | Salmonids | 0 |
| Other | Salmonids | 0 |
| Sweden | Salmonids | 0 |